Important update from TheSchoolRun
For the past 13 years, TheSchoolRun has been run by a small team of mums working from home, dedicated to providing quality educational resources to primary school parents. Unfortunately, rising supplier costs and falling revenue have made it impossible for us to continue operating, and we’ve had to make the difficult decision to close. The good news: We’ve arranged for another educational provider to take over many of our resources. These will be hosted on a new portal, where the content will be updated and expanded to support your child’s learning.
What this means for subscribers:
- Your subscription is still active, and for now, you can keep using the website as normal — just log in with your usual details to access all our articles and resources*.
- In a few months, all resources will move to the new portal. You’ll continue to have access there until your subscription ends. We’ll send you full details nearer the time.
- As a thank you for your support, we’ll also be sending you 16 primary school eBooks (worth £108.84) to download and keep.
A few changes to be aware of:
- The Learning Journey weekly email has ended, but your child’s plan will still be updated on your dashboard each Monday. Just log in to see the recommended worksheets.
- The 11+ weekly emails have now ended. We sent you all the remaining emails in the series at the end of March — please check your inbox (and spam folder) if you haven’t seen them. You can also follow the full programme here: 11+ Learning Journey.
If you have any questions, please contact us at [email protected]. Thank you for being part of our journey it’s been a privilege to support your family’s learning.
*If you need to reset your password, it will still work as usual. Please check your spam folder if the reset email doesn’t appear in your inbox.
What is a tally chart?

What is a tally chart?
Tally charts are used to collect data quickly and efficiently. Filling in a chart with marks representing numbers is faster than writing out words or figures and the data is collected into sub-groups immediately, making it easy to analyse.


Boost your child's maths & English skills!
- Follow a weekly programme
- Maths & English resources
- Keeps your child's learning on track
Children start to look at and use tally charts in Year 3. They start with an empty tally chart like this one:![]()
When collecting the information, for every person who liked a particular part of Christmas the most, a line would be drawn in the correct box. When the child gets to five lines, the fifth line needs to be crossed through the first four. (This makes counting the lines at the end easier!)

The finished tally chart might look like this: 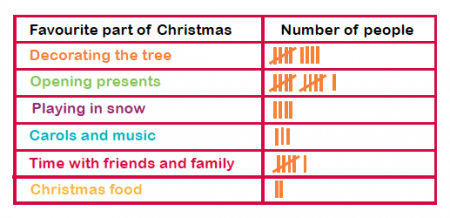
Children then use tally charts to construct bar charts or pictograms.
Children continue to use and interpret tally charts throughout Key Stage 2, and tally charts oftern feature in KS2 maths SATs questions.


