TheSchoolRun.com closure date
As we informed you a few months ago, TheSchoolRun has had to make the difficult decision to close due to financial pressures and the company has now ceased trading. We had hoped to keep our content available through a partnership with another educational provider, but this provider has since withdrawn from the agreement.
As a result, we now have to permanently close TheSchoolRun.com. However, to give subscribers time to download any content they’d like to keep, we will keep the website open until 31st July 2025. After this date, the site will be taken down and there will be no further access to any resources. We strongly encourage you to download and save any resources you think you may want to use in the future.
In particular, we suggest downloading:
- Learning packs
- All the worksheets from the 11+ programme, if you are following this with your child
- Complete Learning Journey programmes (the packs below include all 40 worksheets for each programme)
You should already have received 16 primary school eBooks (worth £108.84) to download and keep. If you haven’t received these, please contact us at [email protected] before 31st July 2025, and we will send them to you.
We are very sorry that there is no way to continue offering access to resources and sincerely apologise for the inconvenience caused.
What is a line graph?

What is a line graph?
A line graph is used to display information which changes over time. It is plotted on a graph as a series of points joined with straight lines.
Children start looking at line graphs in Years 4 and 5. They then need to be able to construct them in Year 6. Often this learning is linked with science, where children may carry out investigations which can then be presented as line graphs (for example, temperature changes over time).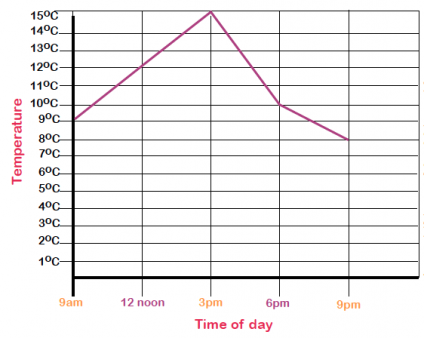

Boost Your Child's Learning Today!
- Start your child on a tailored learning programme
- Get weekly English & maths resources sent direct to your inbox
- Keep your child's learning on track
How to draw a line graph
If a child was creating a graph like the one above, they would need to:
- Remember that the general rule is that time goes along the horizontal axis.
- Look at what their highest temperature was and make sure that the y axis (the vertical axis) went up as high as this number.
- Make sure that there was an equal number of squares in between each number on the y axis.
- Make sure that they started the y axis at 0.
- Think about the x axis (horizontal axis) and how many minutes needed to be shown along here.
- They would again need to make sure that there were an equal number of squares between each number.
- The children would then look at the temperature taken after each minute and plot these points on the graph by marking them with an x.
- They would then join all the xs with llines drawn with a ruler.
Children in Years 5 and 6 may be asked to answer questions on a line graph where the answer cannot be worked out exactly and an estimate needs to be made. This means they need to think carefully about the numbered points on the axes and what numbers might be in between them.


